A service for collecting and visualizing data on the Japanese stock market
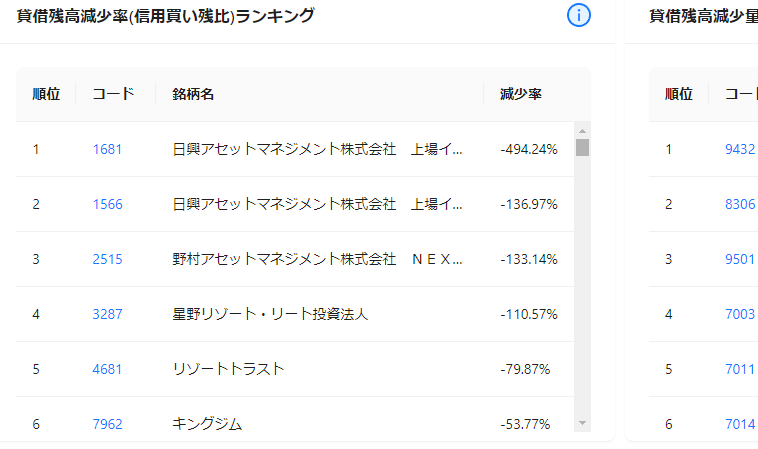
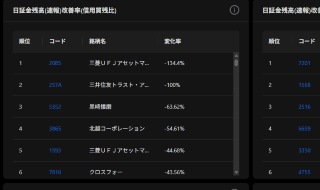
- Improvement rate of margin debt balance (ratio to margin buy balance)
- Improvement amount of margin debt balance
- Worsening rate of margin debt balance (ratio to margin buy balance)
- Worsening amount of margin debt balance
- Margin balance improvement rate
- Margin balance worsening rate
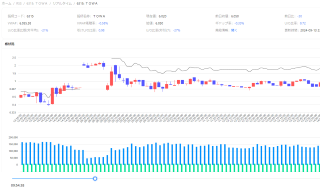
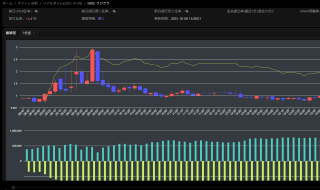
- List of bid/ask and opening price predictions per stock
- Comparison with previous day's volume
- Alert feature
- Order book Under/Over trend
- Order book replay
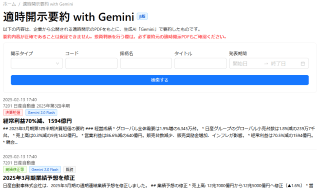
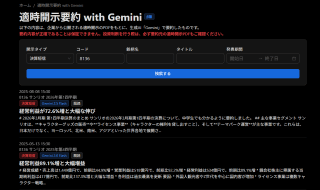
View summaries generated by the generative AI "Gemini" based on timely disclosure PDFs published by companies.
(Limited to subscribers of Standard Plan or higher)
The accuracy of the summary content cannot be guaranteed. When making investment decisions, please always check the original disclosure PDF.
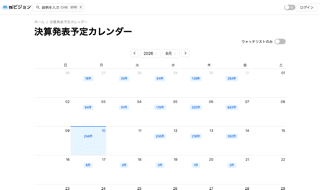
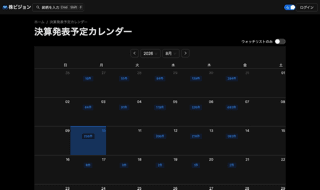
View upcoming earnings announcement dates for issues in a calendar view.
You can also filter to issues in your watchlists (limited to subscribers of Standard Plan or higher).
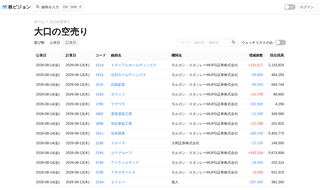
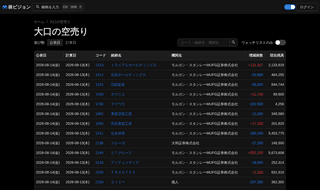
Browse changes in large short selling balances across issues.
You can also filter to issues in your watchlists (limited to subscribers of Standard Plan or higher).
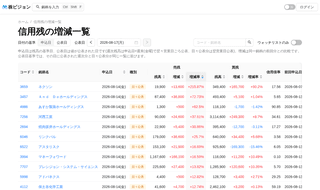
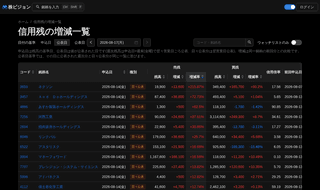
Browse changes in margin buy/sell balances across issues by as-of date.
You can also filter to issues in your watchlists (limited to subscribers of Standard Plan or higher).
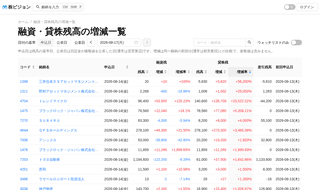
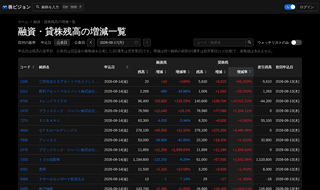
Browse day-over-day changes in JSF debt and lent stock balances (confirmed) across issues.
You can also filter to issues in your watchlists (limited to subscribers of Standard Plan or higher).
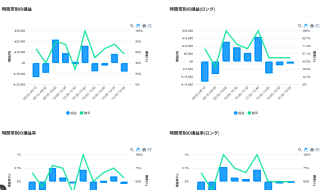
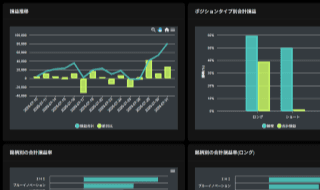
The trade journal is a feature for recording your daily trades, helping you review trades and find areas for improvement.
You can also search for and share trade records.
In addition, subscribers of the Standard Plan or higher can also access a dashboard for viewing trade statistics.
(Trade statistics are currently only supported for day trading.)
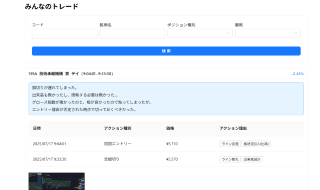
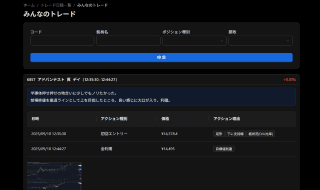
A feature for viewing trade records shared by other users in chronological order.
You can also search and leave comments.
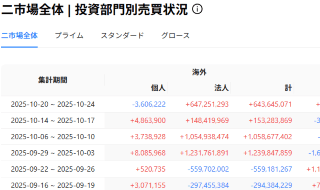
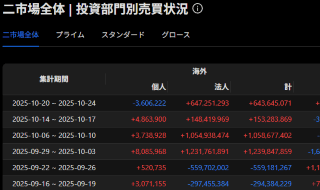
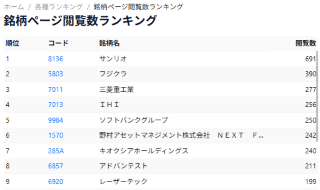
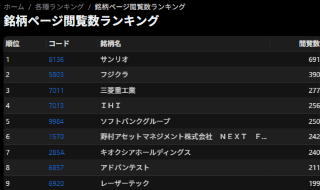
Displays a ranking of the stock pages with the most views recently.
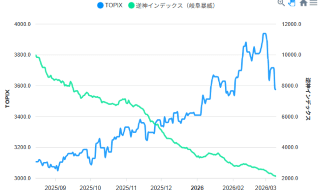
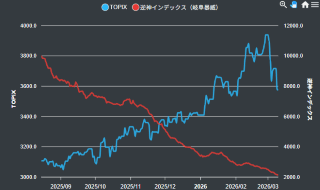
Displays the trend of the Reverse God Index calculated based on posts on X.
Features and Pricing
In addition, features that require a J-Quants API contract are marked with the icon.
icon.
Day Trading Analysis Requirements
- A Rakuten Securities account
- A Windows PC (must meet the recommended environment described in MARKET SPEED II RSS)
- Desktop version of Excel (Office 2016 or later; LibreOffice is not supported)
How to Use the Standard Plan
1. Subscribe to the Standard Plan
here to create your Kabu Vision account.
After registering your account, go to "Billing Settings" to subscribe to the Standard Plan.
2. J-Quants API Contract and Connection (Optional)
J-Quants API If you want to use features that require help page to complete your J-Quants API contract and connect it with Kabu Vision.
For information on the required J-Quants API plan, check the Features and Pricing section and click or tap the icon next to each feature you want to use.
3. Start Using the Standard Plan
Once done, you can start using the Standard Plan.
Enjoy features exclusive to the Standard Plan, such as various rankings and fundamentals information.
If you have any questions, please check the help page.